Using funnel optimization experiments
Read time: 9 minutes
Last edited: Jan 22, 2025
Overview
This guide provides an example of how to create and read the results of a funnel optimization experiment.
A "funnel" is a marketing model that describes a customer's journey through your purchasing cycle, typically from the awareness stage to the purchasing stage. LaunchDarkly's funnel optimization experiments use multiple metrics to track the performance of each of the steps in your funnel over time, and provide results specific to those product funnels. You can use funnel metric groups with funnel optimization experiments to measure the results of multi-step user journeys.
Funnel optimization experiments let your product and marketing teams safely and rapidly increase the performance of your funnels by:
- measuring the performance of your main acquisition and engagement channels
- identifying strong points and weak points in your funnel flow
- testing changes to ensure your funnel's effectiveness improves over time
Prerequisites
To complete this guide, you must have the following prerequisites:
- an understanding of your user funnel and the metrics you want to track at each step in the funnel
- an active LaunchDarkly account with Experimentation enabled, and with permissions to create flags, metrics, and experiments
Concepts
Before you build an experiment, you should read about and understand the following:
Example: new user sign-up flow
In this example, we'll demonstrate how to create an experiment that measures the effectiveness of two different versions of a sign-up form on increasing sign-ups for a product. The experiment will measure the effect on each step in the funnel and determine the most effective variation overall.
Creating this experiment requires six steps:
- Creating a feature flag to experiment on: You can create a new flag, or you may already have an existing flag, to run an experiment on. This flag should control the feature on your site you want to experiment on, and include the variations you want to test as well as a control variation. You can use a boolean flag if you have just one variation to test in addition to the control, or a multivariate flag if you have more than one.
- Creating the metrics for your metric group: Create a metric for each end-user action you want to track as part of your funnel. This might include actions like clicking a sign-up button, entering contact information, opting in to receive emails, and completing payment.
- Creating a funnel metric group: Funnel metric groups organize your metrics together in a set order. This ensures you're tracking end-user behavior in the correct sequence, and lets you reuse the same group in multiple experiments so you don't have re-set up your metrics each time.
- Building the experiment: Building the experiment connects the metric group to your flag and determines the audience you want to run the experiment on.
- Turning flag targeting on and starting an iteration: Your experiment will begin recording data after you turn on flag targeting and start an iteration. You can stop the iteration after you have received enough results to make a decision about the winning variation.
- Reading experiment results: The experiment's Results tab includes information about how each variation performed in each step of the funnel, as well as the winning variation overall.
These steps are explained in detail below.
Create the feature flag
Imagine you have noticed that in your sign up flow, a lot of users drop off at your payment step. You think it might be related to the user interface (UI), so you’re going to test two new versions of the payment screen.
To test these versions, first create a feature flag for your experiment with three variations: a payment option with a drop-down menu, with a radio button, and with the current UI which will serve as the control.
To create the flag:
- Click Create and choose Flag. The "Create new flag" page appears.
- Enter "Enable new sign-up menu options" for the Name.
- (Optional) Enter a Description of the flag.
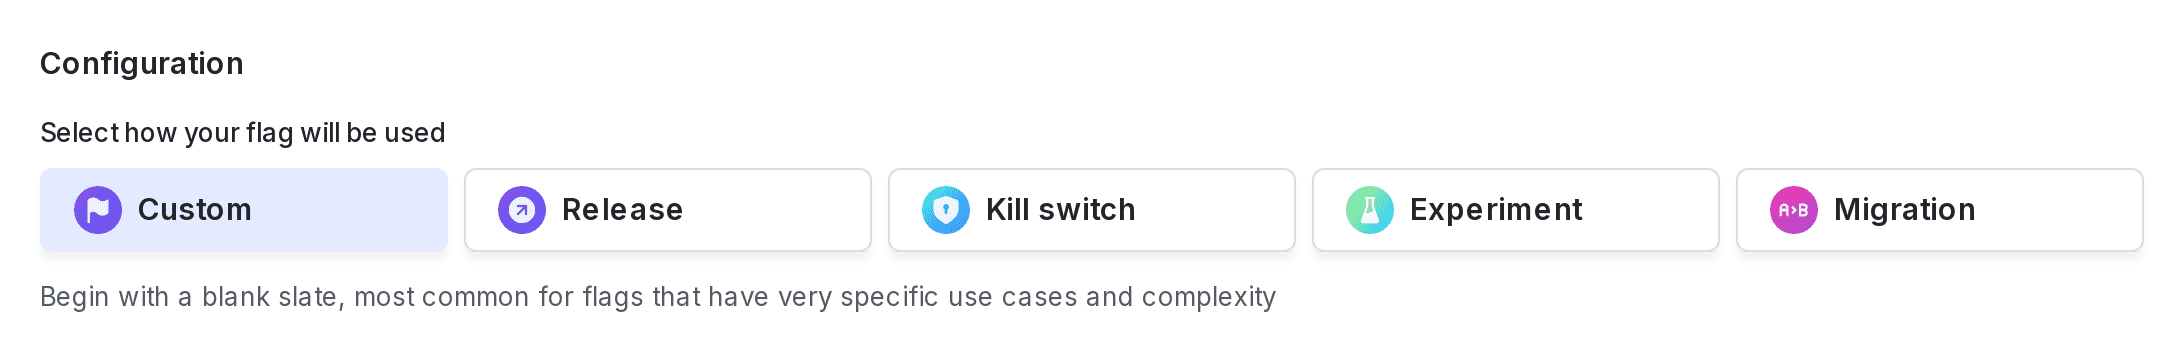
- Choose the Experiment flag template.
- Select the String flag variation type.
- For the first variation, update the Name to "Control."
- For the second variation, update the Name to "Dropdown select."
- For the third variation, update the Name to "Radio select."
- Click Create flag.
Here is what the Variations section of a flag's right sidebar looks like:
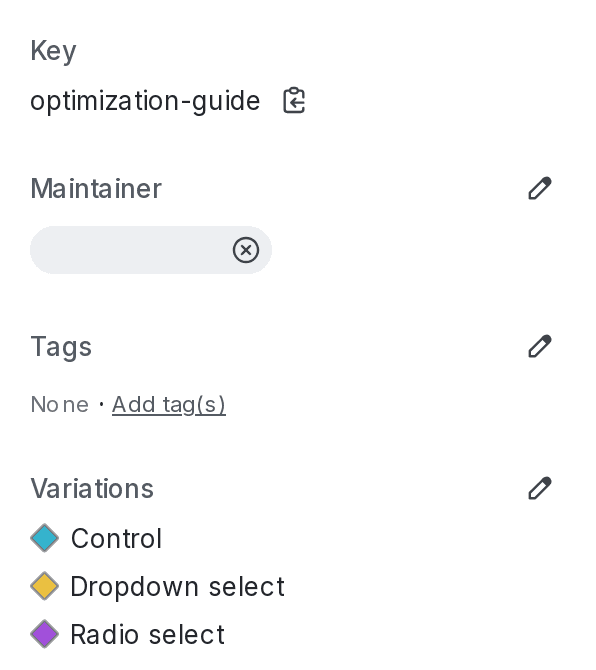
To learn more about creating flags, read Creating new flags.
Create metrics
Next, create the metrics in your funnel.
In this example, your sign-up flow has four steps:
- The customer clicks your site's "Sign up" button
- They enter their personal information
- They add a payment method
- They click the "Pay now" button
This table explains the metrics you will create for this example:
| Name | Metric type | Target type | Randomization unit |
|---|---|---|---|
| Sign-up button clicked | Clicked or tapped | Exact match | user |
| Sign-up info entered | Custom conversion binary | n/a | user |
| Sign-up payment added | Custom conversion binary | n/a | user |
| Sign-up completed | Clicked or tapped | Exact match | user |
Create the "Sign-up button clicked" metric
To create the first clicked or tapped metric:
- Navigate to the Metrics list.
- Click Create metric. The "Create metric" dialog appears.
- Select an event kind of Clicked or tapped.
- Enter the CSS selector for your sign-up button in the Click targets field. In this example, the selector is
.button. - Select the "exact match" Target type.
- Enter the Target URL that corresponds to your sign-up button:
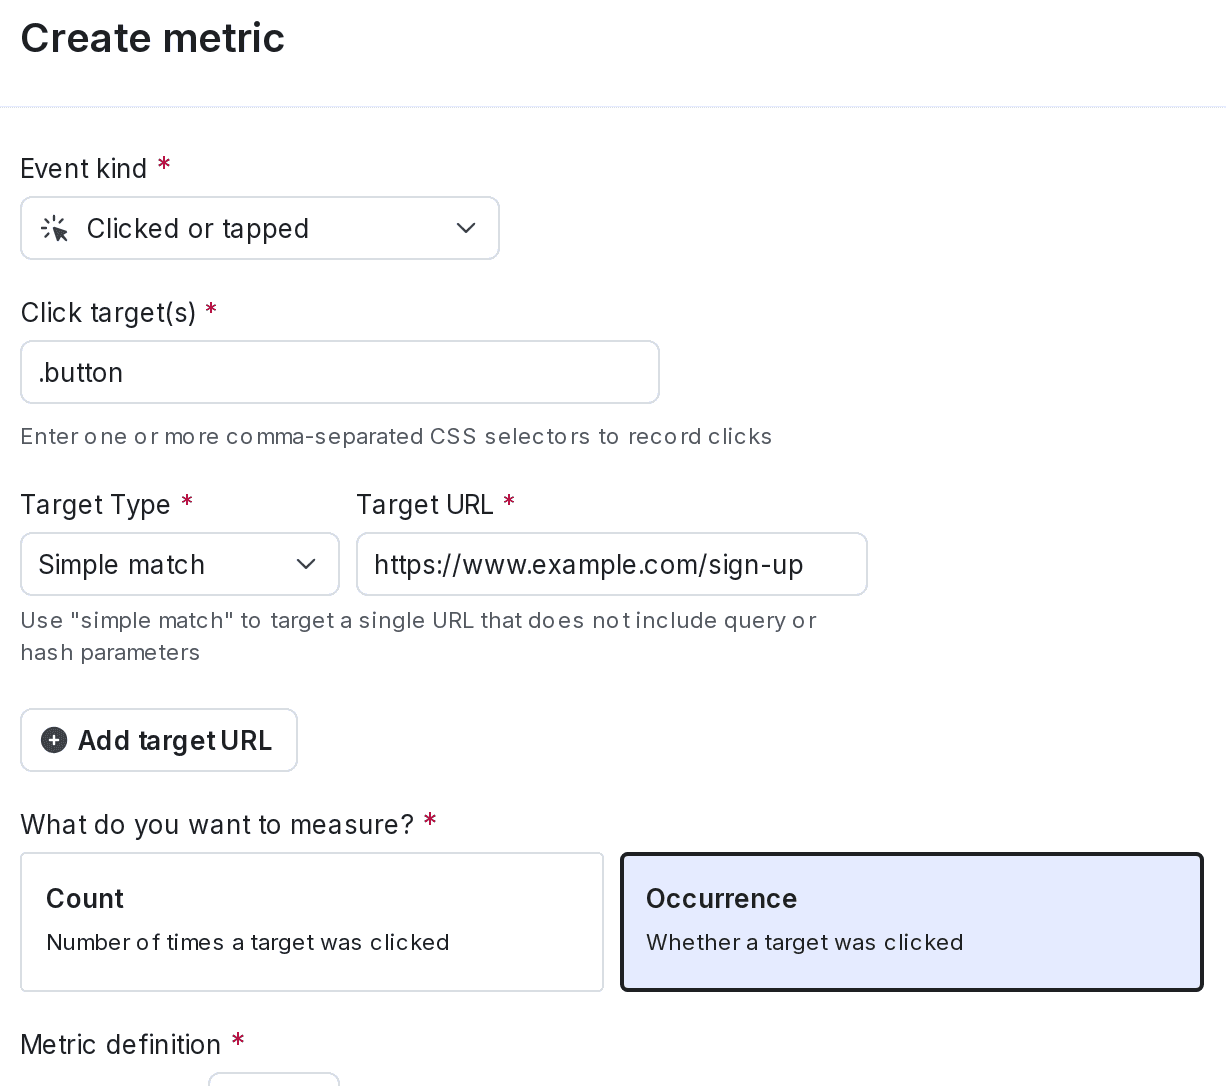
- Choose Occurrence as what you want to measure.
- In the "Metric definition" section, select "Percentage of User units that clicked"
- Enter "Sign-up button clicked" as the Name.
- Click Create metric.
Create the "Sign-up info entered" metric
To create the second custom conversion binary metric:
- Navigate to the Metrics list.
- Click Create metric. The "Create metric" dialog appears.
- Select an event kind of Custom.
- Enter an Event key such as
info-entered. You will reference this event name in your code snippet when you insert the metric information into your app. - Choose Occurrence as what you want to measure.
- In the "Metric definition" section, select the following:
- Percentage of User units that sent the event,
- where higher is better
- Enter "Sign-up info entered" as the Name.
- Click Create metric.
Create the "Sign-up payment added" metric
To create the third metric, repeat the process for creating the "Sign-up info entered" custom conversion binary metric, but name the metric "Sign-up payment added" and choose an event name like payment-entered.
Create the "Sign-up completed" metric
To create the fourth metric, repeat the process for creating the "Sign-up button clicked" clicked or tapped metric, but name the metric "Sign-up completed" with a target type of "Exact match."
To learn more, read Metrics.
Create a funnel metric group
Now that you have created your four metrics, you can combine them together into a funnel metric group.
To create your funnel metric group:
- Navigate to the Funnel groups tab from the Metrics list.
- Click Create metric group. The "Create metric group" dialog appears.
- Enter "New plan sign-up flow" for the Name.
- Enter "click sign up" as the first Step name.
- Choose the "Sign-up button clicked" metric from the Metric menu.
- Enter "Info entered" as the second Step name.
- Choose the "Sign-up info entered" metric from the Metric menu:

- Click Add metric and repeat steps 4-5 for the remaining two steps in your funnel.
- Click Create metric group.
The order of your metrics within a funnel metric group must match the order of the steps your users will take within the funnel. If they do not match the order of your user flow, your experiment results will be invalid.
To learn more, read Metric groups.
Build the experiment
Next, it's time to put it all together to create a funnel optimization experiment.
As you decide on the percentage of traffic you want to include in the experiment, you may want to consider the number of Experimentation keys you have available in the LaunchDarkly plan you subscribe to. For example, if you have 50,000 Experimentation keys per month included in your plan, and you run ten experiments per month, you may want to limit your experiment audiences to no more than 5,000 keys each. To learn more, read Experimentation keys.
To build the experiment:
- Click Create and choose Experiment. The "Create experiment" page appears.
- Enter "New user sign-up flow" for the Name.
- Enter a Hypothesis such as "Using a better sign-up UI will result in a higher number of overall sign ups for the product."
- Select Funnel optimization.
- Click Next. The "Choose randomization unit and attributes" step opens.
- Choose the "user" context kind from the Randomization unit menu.
- Click Next. The "Select metrics" step opens.
- Choose your "New plan sign-up flow" Funnel group:

- Click Next. The "Choose flag variations" step opens.
- Choose "Enable new sign-up menu options" from the Flag menu.
- Click Next. The "Set audience" step opens.
- (Optional) Check the Add experiment to layer checkbox if you want to exclude contexts in this experiment from other experiments.
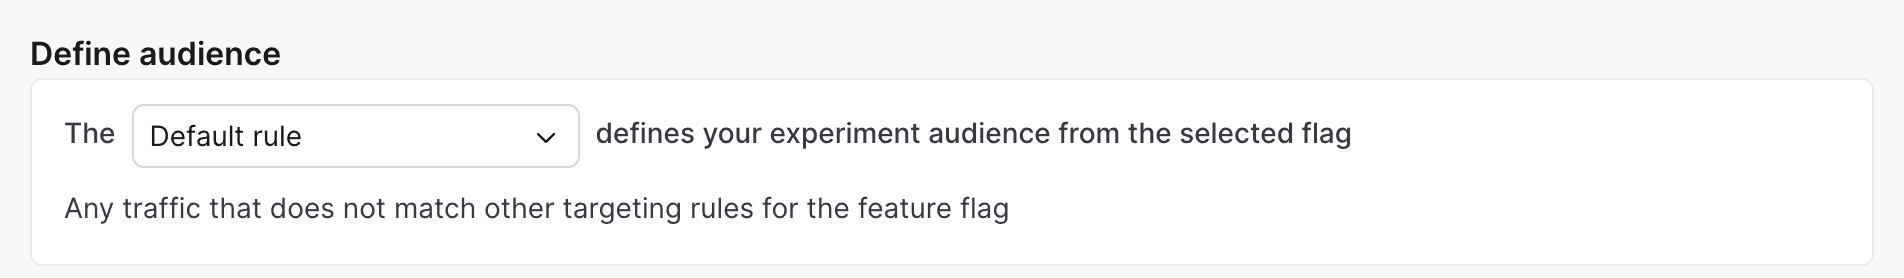
- Choose the default targeting rule to run the experiment on.
- Select the percentage of traffic you want to include in the experiment. In this example, 10% will be in the control variation, 10% will be in the "Dropdown select" variation, and 10% will be in the "Radio select" variation.
- Select the control variation to serve to the remaining population.
- Choose to split the experiment audience Equally.
- Click Finish. You are returned to the experiment's Design tab.
To learn more, read Creating experiments.
Turn flag targeting on and start an iteration
When you're ready, turn your flag's targeting on and begin recording results by clicking Start on the experiment's Design tab:

To learn more, read Turning flags on and off and Start experiment iterations.
Experiment results
After enough users have encountered your experiment, you can evaluate its performance on the experiment's Results tab.
The winning variation displays at the top of the probability report:

The "Radio select" variation is performing best for this funnel.
You can examine the results more closely in the probability report. Here, you can see that the "Radio select" variation has a conversion rate of about 18%:

However, you can also see that in the third "sign up payment added" step, the "Dropdown select" variation actually performed slightly better at 32% than the "Radio select" variation at 31%, but for some reason users aren’t completing the purchase as often. Still, LaunchDarkly declared the "Radio select" variation the winner because it had the highest conversion rate of all the variations in the funnel overall.
To learn more, read Winning variations.
Snowflake users who want to explore this data more in-depth can send all of the experiment data to a Snowflake database using the Snowflake Data Export integration. After your experiment data is in the same warehouse as your other data, you can easily build custom reports to answer more complicated product behavior questions. To learn more, read Snowflake Data Export.
Conclusion
In this guide you learned how to create a funnel optimization experiment to measure the success of a user funnel. You learned how to create the flag, how to set up metrics and a metric group, how to build the experiment, and how to interpret funnel optimization experiment results. To learn more about how you can use Experimentation to meet your business needs, contact contact Sales or your LaunchDarkly representative.
Your 14-day trial begins as soon as you sign up. Get started in minutes using the in-app Quickstart. You'll discover how easy it is to release, monitor, and optimize your software.
Want to try it out? Start a trial.