Sending OpenTelemetry traces to LaunchDarkly
Read time: 7 minutes
Last edited: Dec 07, 2024
Sending OpenTelemetry traces to LaunchDarkly is only available to members of LaunchDarkly's Early Access Program (EAP). If you want access to this feature, join the EAP.
Enabling OpenTelemetry traces in your server-side SDKs is available to all customers. To learn more, read OpenTelemetry.
Overview
This topic explains how to send OpenTelemetry traces to LaunchDarkly. LaunchDarkly converts this data into events that LaunchDarkly metrics track over time. Experimentation and guarded rollouts use these metrics to measure flag performance.
This topic covers:
- how to send trace data to LaunchDarkly
- how to configure your collector to receive, process, and export telemetry data
- how to create metrics from OpenTelemetry trace data
About OpenTelemetry
OpenTelemetry (OTel) is an open source observability framework and toolkit designed to create and manage telemetry data such as traces, metrics, and logs. You can use LaunchDarkly's OpenTelemetry protocol (OTLP) endpoint to send OpenTelemetry traces to LaunchDarkly.
LaunchDarkly converts the information contained in these traces to produce events for use with Experimentation and guarded rollouts. Typically the information you collect in the traces is related to API performance and errors.
Because OpenTelemetry is vendor- and tool-agnostic, you can reuse the instrumentation that may already exist in your code to create LaunchDarkly metrics without changing application code.
LaunchDarkly supports receiving trace data over gRPC, HTTP/protobuf, and HTTP/JSON.
Send trace data to LaunchDarkly
To send OpenTelemetry trace data to LaunchDarkly, we recommend using the OpenTelemetry Collector. The OpenTelemetry Collector is a vendor-agnostic proxy that can receive, process, and export telemetry data. You can configure an OpenTelemetry pipeline with a processor to filter out data that is not relevant to LaunchDarkly, reducing data transport costs, and to send data to LaunchDarkly in addition to other OTLP backends that you may already be using.
LaunchDarkly processes two types of data from your OpenTelemetry traces:
- HTTP span attributes, including latency, 5xx occurrences, and other errors, where the span has or overlaps with another span that has at least one feature flag span event
- exception span events that occur in the wake of a feature flag span event
A feature flag span event is defined as any span event that contains a feature_flag.context.key attribute. LaunchDarkly ignores traces that do not include span events with this attribute.
To ensure your spans have compatible feature flag events, configure your SDK to use the OpenTelemetry tracing hook. This hook automatically attaches feature flag event data to your OTel traces for you.
Try it in your SDK: OpenTelemetry
Generate a new LaunchDarkly service token
All trace data sent to LaunchDarkly must be authenticated with a LaunchDarkly personal or service API access token with a Writer role, or a custom role that allows the token to perform the importEventData action on the LaunchDarkly environment you are targeting.
Here's how to create an API service token with the appropriate inline policy:
-
Click the gear icon in the left sidenav to view Organization settings. The General settings page appears.
-
Click Authorization.
-
Click Create token. The "Create access token" dialog appears.
-
Give your token a human-readable Name, such as "Compass integration."
-
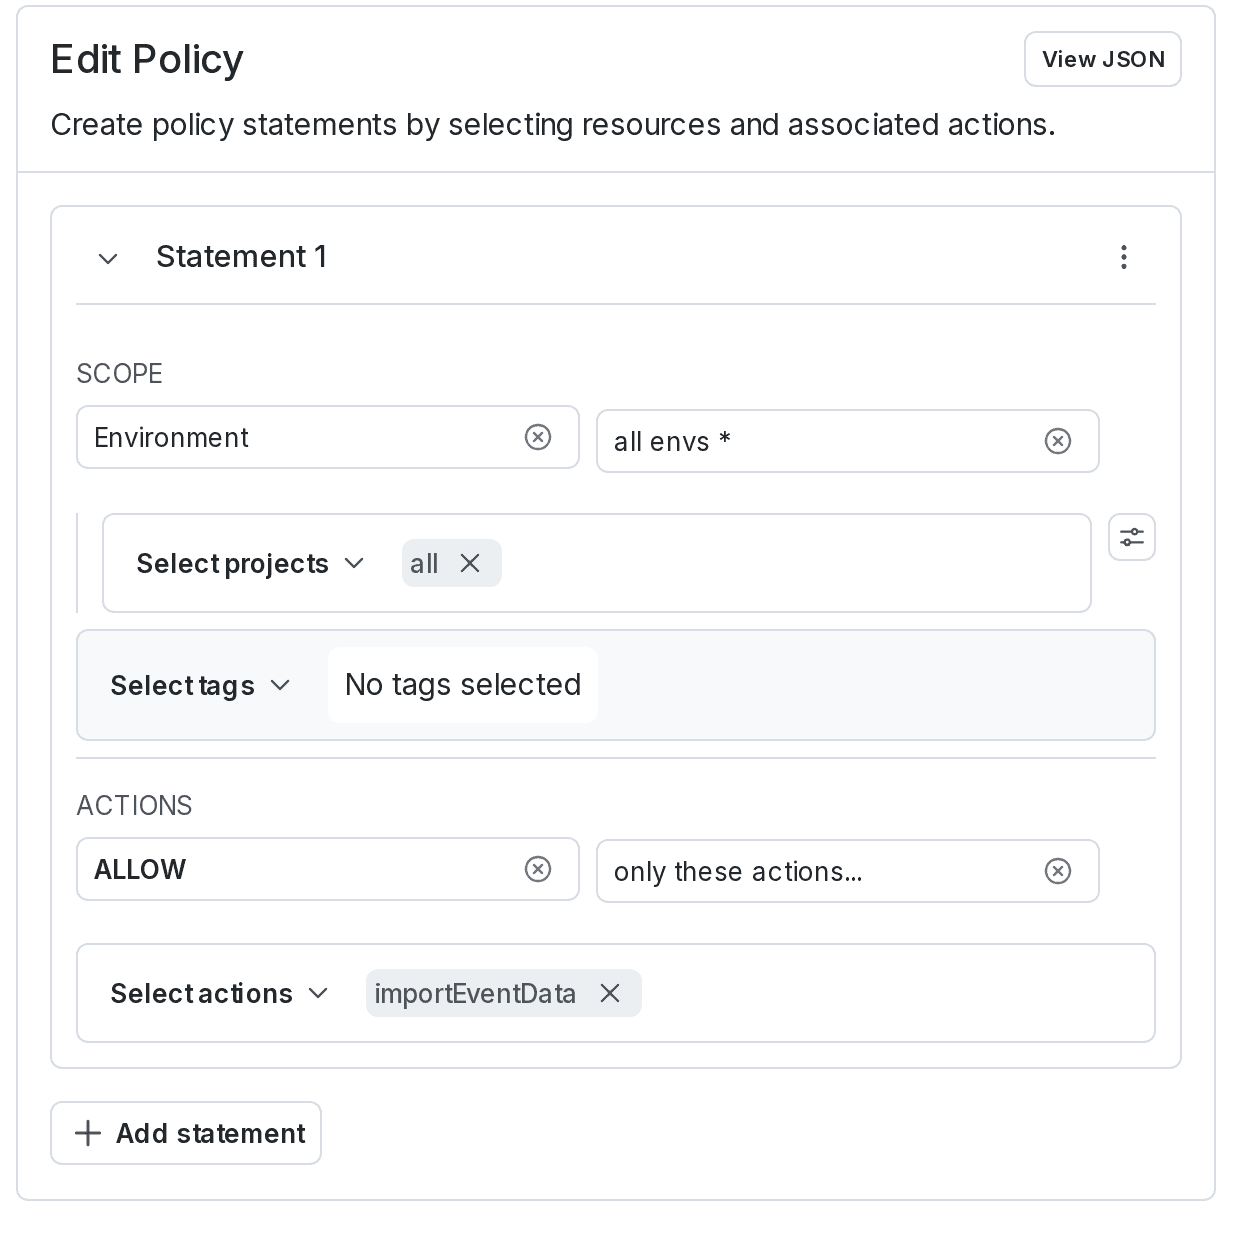
Give your token an "Inline policy" Role.
-
Click the Advanced editor button and specify the following policy in the Editor field to allow the token to perform the
importEventDataaction on all LaunchDarkly environment resources: -
Select This is a service token.
- Click Save token and copy the newly created token to your clipboard. You will need it to configure the OpenTelemetry collector in the following section.
Collector configuration
Collector pipelines consists of three components: receivers, exporters, and processors. Because the exporter is sending data to LaunchDarkly, it requires a LaunchDarkly access token. To learn how to create an access token, read API access tokens.
To configure a pipeline to send trace data to LaunchDarkly, modify the Collector's config file, otel-collector-config.yaml, as follows:
Create LaunchDarkly metrics from OpenTelemetry trace data
When LaunchDarkly receives OpenTelemetry trace data, it processes and converts this data into events that LaunchDarkly metrics track over time. Experimentation and guarded rollouts use these metrics to measure flag performance.
There are two types of events that LaunchDarkly creates from OpenTelemetry traces: route-specific events and global events. Route-specific events are useful when you are experimenting with a change that is known to impact a small subset of your server's HTTP routes. Global events are useful when you believe your change may impact all routes, or when you are not sure of the impact of your change.
Use the following table to create LaunchDarkly metrics from the events that LaunchDarkly produces from your OpenTelemetry trace data. To learn more about LaunchDarkly metrics, read Metrics.
| Event type | LaunchDarkly metric properties | Event name template and examples |
|---|---|---|
| per-route HTTP request latency |
| http.latency;method={http.request.method};route={http.route} Examples: http.latency;method=GET;route=/api/v2/flags http.latency;method=PATCH;route=/api/v2/flags/{id} |
| global HTTP request latency |
| otel.http.latency Example: otel.http.latency |
| per-route HTTP request errors |
| http.error;method={http.request.method};route={http.route} Examples: http.error;method=GET;route=/api/v2/flags http.error;method=PATCH;route=/api/v2/flags/{id} |
| global exceptions |
| otel.exception Example: otel.exception |
| global HTTP 5xxs |
| otel.http.5XX Example: otel.http.5XX |
| per-route HTTP 5xxs |
| http.5XX;method={http.request.method};route={http.route} Examples: http.5XX;method=GET;route=/api/v2/flags http.5XX;method=PATCH;route=/api/v2/flags/{id} |
LaunchDarkly supports both the 1.20.0 and 1.23.0 versions of the OpenTelemetry semantic conventions, so you can use http.request and http.status_code instead of http.request.method and http.response.status_code if you are using 1.20.0. To learn more, read OpenTelemetry's HTTP semantic convention migration guide.
When you create a per-route metric, you must provide the http.request.method and http.route for each metric in the string templates specified in the table above. It is important that the method and route match the corresponding HTTP semantic convention attributes in the spans you are sending to LaunchDarkly.