Release Guardian
Read time: 11 minutes
Last edited: Jul 19, 2024
Release Guardian is available as an add-on to customers on an Enterprise plan. To learn more, read about our pricing. If you want access to this feature, contact your LaunchDarkly account representative.
Overview
This topic explains how to use Release Guardian to monitor the health of flag releases and how to configure LaunchDarkly to take action on the results. Release Guardian is a suite of functionality that lets you attach metrics to flags to monitor for regressions. You can use Release Guardian to notify you or automatically roll back changes that have a negative effect on your app's performance.
About guarded rollouts
When you make a flag change, you can attach metrics to the flag to monitor changes in your app performance and guard against any regressions that result from the release. You can use metrics to track a variety of system health indicators and end-user behaviors, from engineering metrics like errors and latencies, to product metrics like clicks and conversions. To learn more, read Metrics.
You can connect metrics to LaunchDarkly using any of the following methods:
- Use one of our metrics integrations
- Call the metric import API
- Use a LaunchDarkly SDK to send custom events, and connect them to metrics
- Enable OpenTelemetry in a LaunchDarkly SDK, send the OpenTelemetry traces to LaunchDarkly, and connect them to metrics
You can monitor metrics on any flag rule, except rules serving a percentage rollout and those in use in a running experiment.
Regressions
When you attach metrics to a flag and then toggle the flag on or change the variation served, LaunchDarkly detects if the change is having a negative impact on your app or audience. This negative effect is called a "regression." You can configure LaunchDarkly to either notify you of the regression, or notify you of the regression and automatically roll back the release. To learn how LaunchDarkly detects regressions, read Time series charts and tables.
Add metrics to a flag
Before you can add metrics to flags, you must create the metrics you want to monitor. To learn how, read Creating metrics.
You can only use guarded rollouts with custom numeric and custom conversion/binary metrics. You can't guard a rollout with a click or page view metric. To learn more, read Creating metrics.
To add metrics to an existing flag:
- From the flags list, click on the flag you want to add a metric to.
- Click Add metrics.
- Select one or more Metrics.
- Click Save.
To add metrics to a new flag:
- Follow the instructions for Create a feature flag.
- Select one or more Metrics to monitor.
- Click Next and finish the flag creation process.
Begin monitoring
You can begin monitoring metrics:
- when you toggle the flag on and begin serving a new variation, or
- if the flag is already toggled on, when you make a change to a flag variation.
If any of the metrics you attached to the flag have more than one randomization unit, you must decide on a single randomization unit when you begin monitoring. The randomization unit is the context kind that LaunchDarkly uses to assign traffic to each of a flag's variations. To learn more, read Randomization units.
To begin monitoring metrics on a flag:
- On the flag rule you want to monitor, click Guard. The "Guard your rollout" section appears.
- If the Guard button is disabled, you either need to toggle the flag on, or select a new variation to begin serving.
- If your metrics have more than one randomization unit, choose a randomization unit to allocate your traffic by.
- Enter the percentage of traffic you want to monitor in the Traffic allocation field.
- Choose a monitoring Length of time and Unit of time.
- (Optional) Check the Automatically roll back rule if a regression is detected option if you want LaunchDarkly to automatically roll back your change when it detects a regression, in addition to a notification.
- Click Review and save. The "Save changes" dialog appears.
- Complete the "Save changes" fields as needed and click Save changes.
The rule now displays how many contexts have been exposed to the rule and the metrics being monitored.
If LaunchDarkly detects a regression, LaunchDarkly sends you an email, an in-app notification, and, if you have the integration configured, a Slack or Microsoft Teams notification. To learn how to set up these integrations, read Setting up Slack accounts and permissions and Setting up the Microsoft Teams integration.
Flag monitoring states
When you are monitoring metrics on the flag, a message displays at the top of the flag targeting page:
- N minutes/hours/days left: LaunchDarkly is actively monitoring metrics on the flag rule.
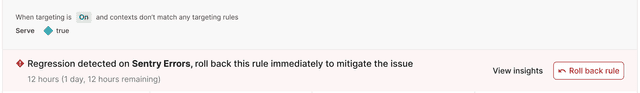
- Regression detected: LaunchDarkly found a regression and sent a notification, but did not rollback the release. This message may appear during or after the monitoring window has ended.
- Regression mitigated: LaunchDarkly found a regression, sent a notification, and automatically rolled back the release. This message may appear during or after the monitoring window has ended.

Roll back releases
To manually roll back a release after LaunchDarkly has detected a regression:
-
From the flag's targeting page, find the rule with the detected regression.
-
Click Roll back rule. The "Stop rollout early" dialog appears.
Information about metric performance on a flag's default rule. -
Choose which Variation to serve to all contexts after you stop monitoring. The field defaults to the control variation.
-
Click Stop.

Metric insights
To view more information about a metric's performance, click the name of the metric. The metric's time series chart and table appears:

Each metric you add to the flag generates a time series chart that displays the metric's results over time for each variation, and a table with the lower and upper bounds of the metric results for each variation. To learn more, read Time series charts and tables.
To view more information about the performance of all attached metrics, click View results:

This opens the flag's Insights page.
The Insights page
After you add a metric to a flag, the flag's Insights page displays information about the guarded rollout and each metric's performance.

The Insights page includes the following information about the guarded rollout:
- The date and time of the measured rollout
- The name of the monitored rule, and if automatic rollback is enabled
- The percentage of a rule's traffic you assigned to be monitored
- The length of the monitoring window
- The number of contexts monitored during the monitoring window
You can monitor subsequent rollouts on the the same flag if you toggle the flag off and then on again, or if you change the variation served for a particular rule.
To view the results of a past rollout on a flag, change the date range from the date selection menu:

Time series charts and tables
This section includes an explanation of advanced statistical concepts. We provide them for informational purposes, but you do not need to understand these concepts to use Release Guardian. LaunchDarkly automatically will notify you if your release has had a negative effect on your application.
Each metric you include in a guarded rollout generates the following:
- A time series chart that displays the metric's results over time for each variation. The solid line represents the point estimate of the metric, which is the estimated mean of the metric values for the variation. The larger shaded area represents the range that contains 90% of the metric's probable values for the variation, called the credible interval. The longer the metric collects data, the narrower and more precise the credible interval should become.
- A table listing the lower and upper bounds of the confidence interval for each variation at the end of the monitoring period. In the time series chart, the confidence interval is the shaded area surrounding the solid line for each variation. Any variation that had a regression is highlighted in the table in red.
This illustration shows where the upper and lower bounds are for two variations in an example time series chart:

LaunchDarkly uses the upper and lower bounds to determine if the guarded release has had a regression.
LaunchDarkly considers the following scenarios a regression:
- For metrics where a lower value is better, LaunchDarkly considers it a regression when the lower bound of the treatment’s confidence interval exceeds the upper bound of the control’s confidence interval.
- For metrics where a higher value is better, LaunchDarkly considers it a regression when the upper bound is less than zero.
This graphic displays the confidence interval for an example numeric metric for which lower values are better, and what a regression looks like:

Manage guarded rollouts
You can edit or remove metrics attached to a flag, as well as stop a monitoring window early and roll out the release.
Edit metrics attached to a flag
To edit the metrics attached to a flag, click the pencil icon next to "Guarded rollout metrics" in the side panel:

Then, use the "Edit metrics" dialog to add or remove metrics from the flag.
Remove metrics from a flag
To remove all metrics from a flag, click the Metrics button and select Remove all metrics.
Stop monitoring early
If you want to stop monitoring before the monitoring window is over:
- From the flag's targeting page, click Stop monitoring. A "Stop rollout early" dialog appears.
- Choose which Variation to serve to all contexts after you stop monitoring. The field defaults to the control variation.
- Click Stop.