Historical results for Bayesian experiments
Read time: 2 minutes
Last edited: Dec 06, 2024
Overview
This topic explains how to read and use the Historical results tab of a Bayesian experiment.
The Historical results tab lets you see a variation's performance over time. You can view a variation's Relative difference from Control and its Conversion rate.
Relative difference from Control
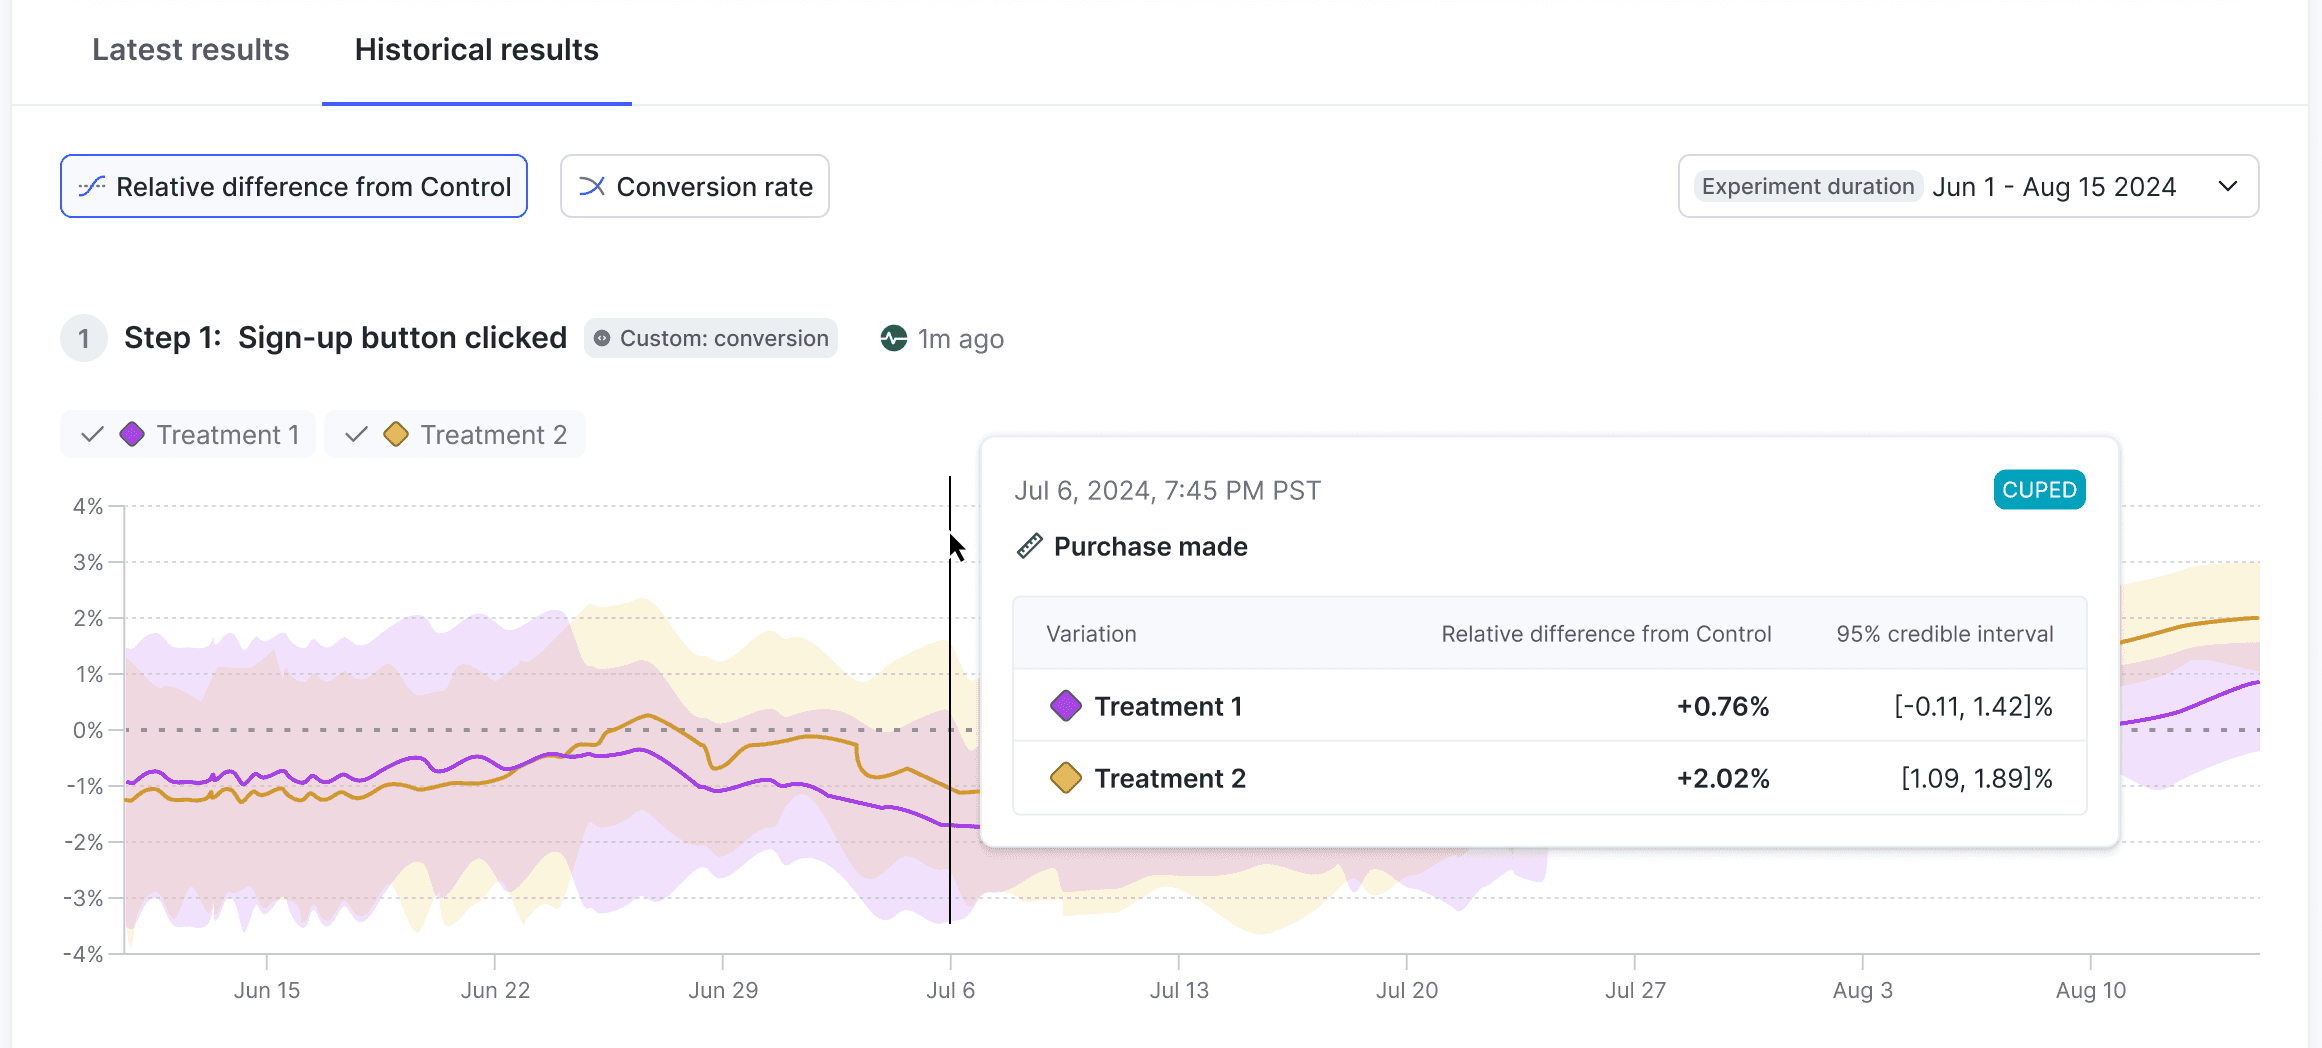
Click Relative difference from Control to view flag variation relative differences from the control over time.
The relative difference from the control variation is the difference between the treatment variation's conversion rate and the control variation's conversion rate. Hover on any point of the chart to view the relative difference from control and 95% credible interval for each variation tested.
Conversion rate
Click Conversion rate to view flag variation conversion rates over time.
The conversion rate is:
- for binary metrics, the percentage of contexts that triggered at least one conversion event
- for count metrics, the total number of times a context triggered a conversion
The conversion rate displays for conversion metrics only.
Posterior mean
Click Posterior mean to view flag variation posterior means over time. The posterior mean is the average numeric value that you should expect for a variation, based on the data collected so far.
The posterior mean displays for numeric metrics only.
When to ship winning variations
Early experiment results tend to be "noisy," with a large credible interval, because the metric hasn't yet collected enough data to determine a clear winner. As the experiment continues to run, its results will stabilize over time. The longer the experiment runs, the narrower and more precise the credible interval should become and the more confidence you can have in the results of the experiment.
Viewing an experiments's historical results helps you determine when the experiment has run long enough to make a decision about the winning variation:
- If the credible interval is continuing to narrow, you may want to continue to let the experiment run so its results become more precise.
- If the credible interval has stabilized, it's likely that you have gathered all of the data you need to select a winning variation and stop the experiment.