Analytic formulas for Bayesian experiment variation means
Read time: 6 minutes
Last edited: Jan 07, 2025
This section includes an explanation of advanced statistical concepts. We provide them for informational purposes, but you do not need to understand these concepts to use the formulas in the experiment results user interface (UI).
Overview
LaunchDarkly displays analytic formulas for all experiment variation means. This guide explains the statistical methodology for these formulas for experiments using Bayesian statistics, and how they are useful for validating your results.
Formulas
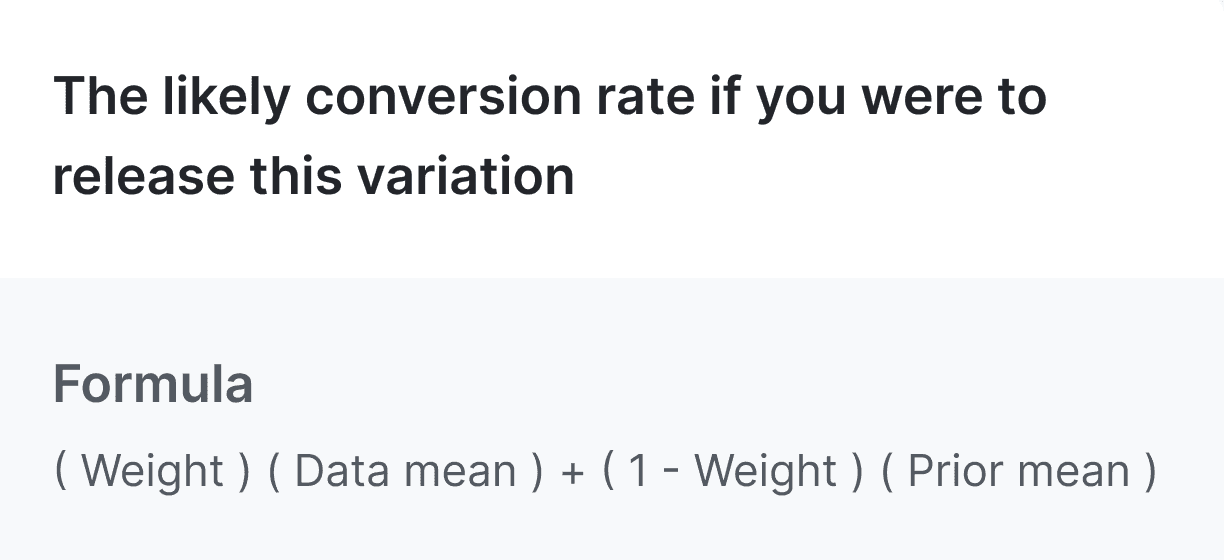
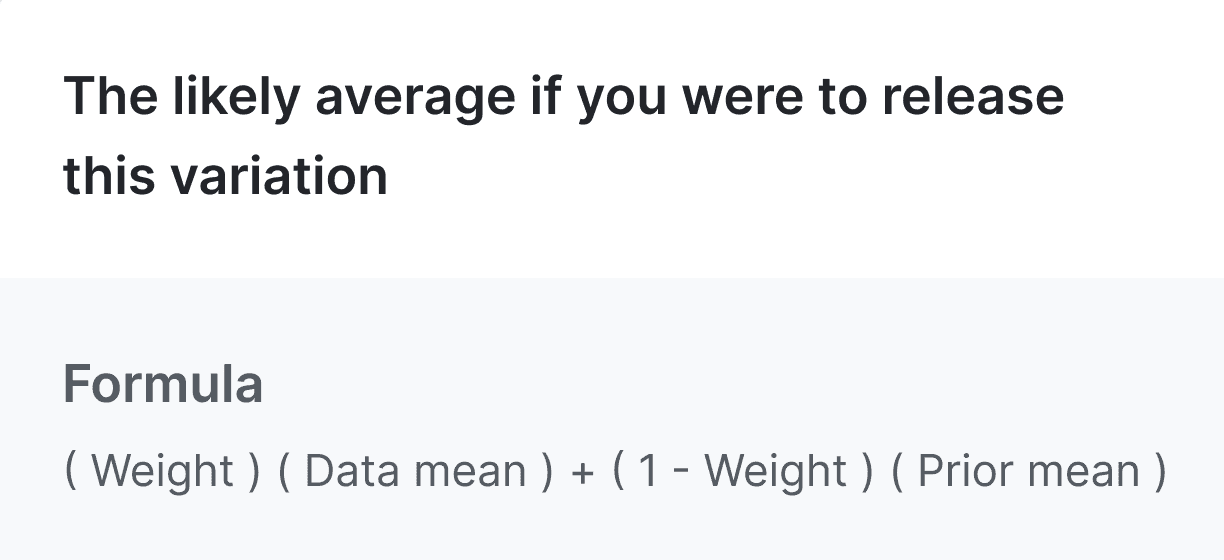
Using the Bayesian approach, the posterior means for all experiment variations and for any metric type, including conversion metrics and numeric metrics, can be represented by the following formula:
where:
- Data mean: the mean estimated from the data sample
- Prior mean: the mean for the Bayesian prior distribution assumed for the experiment variation mean
- Weight: the precision weight of the data mean, which is the precision of the data mean divided by the sum of the data mean precision and the prior precision
Whether an experiment's results table displays the conversion rate or posterior mean is dependent on the kind of metrics you're using. Experiments using conversion metrics display the conversion rate, and experiments using numeric metrics display the posterior mean.
When you hover over the "Conversion rate" heading in an experiment's results table, this formula appears:
When you hover over the "Posterior mean" heading in an experiment's results table, this formula appears:
For the control variation, the precision weight is trivially 1 at sufficient sample sizes, so the posterior mean for the control variation is equal to the data mean. For the treatment variation, the posterior mean is a precision-weighted average of the data mean and the prior mean.
When you hover over an actual conversion rate or posterior mean value, you can view actual numbers in the formulas instead of descriptions.
We explain the data mean, prior mean, and precision weight in the following sections.
Data mean
The formula for the data mean depends on whether LaunchDarkly has applied covariate adjustment through CUPED. To learn more, read Covariate adjustment and CUPED methodology.
Formulas without CUPED applied
When CUPED is not applied to an experiment metric, the data mean equals the observed sample mean.
The formula is different for conversion metrics and numeric metrics:
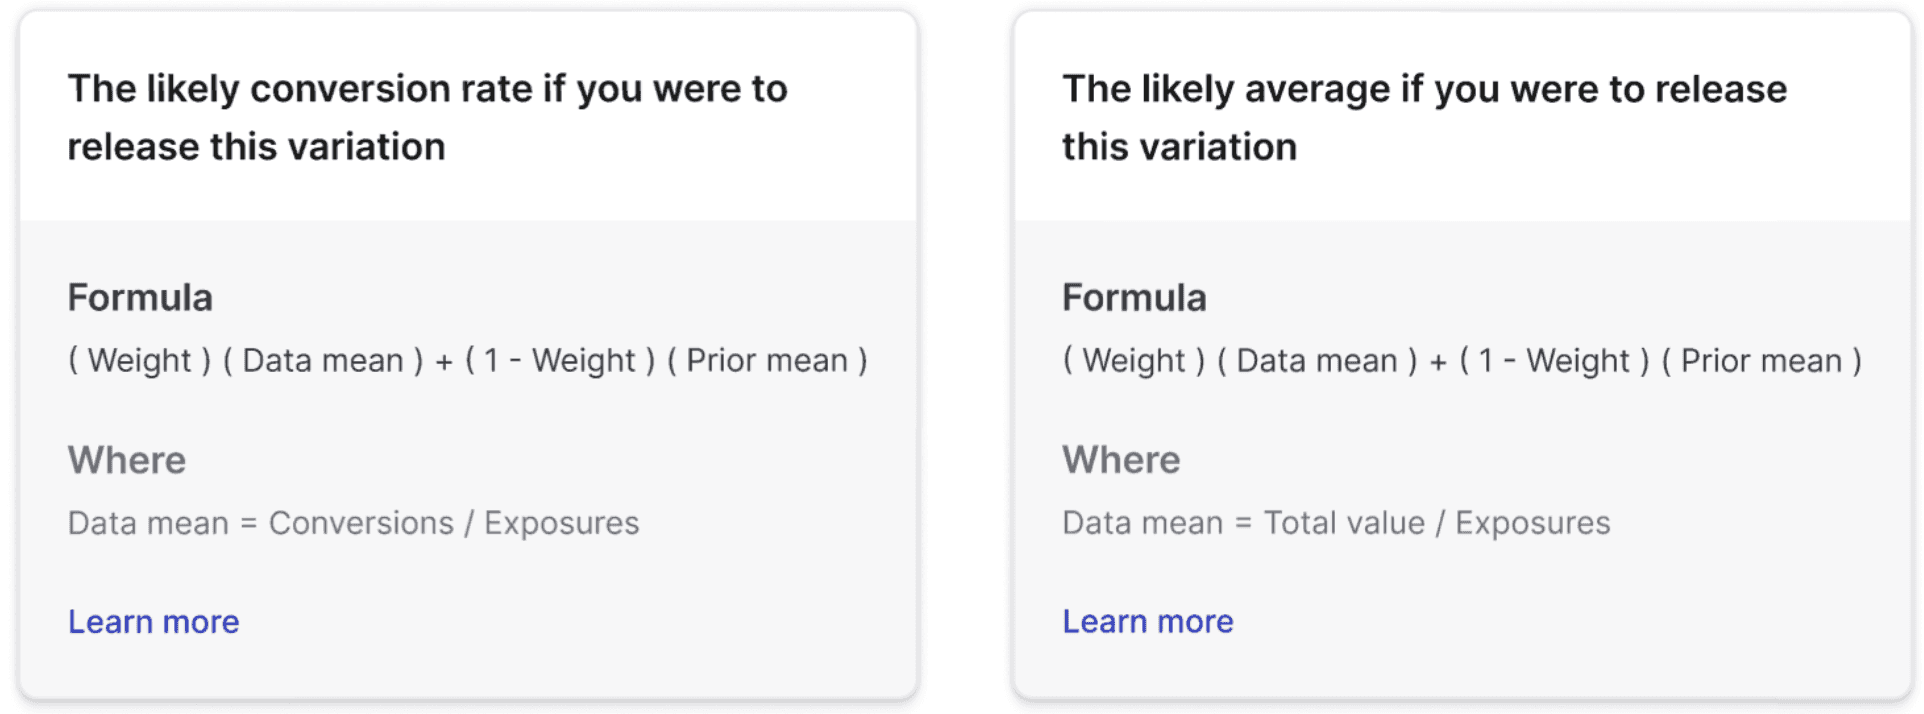
- Conversion metrics, including custom conversion binary, custom conversion count, page viewed, and clicked or tapped metrics, use the total number of conversions divided by the total number of exposures:
- Numeric metrics use the total value divided by the total number of exposures:
When you hover over the "Conversion rate" and "Posterior mean" headings, you can view the above formulas for the data mean when LaunchDarkly does not apply CUPED:
Formulas with CUPED applied
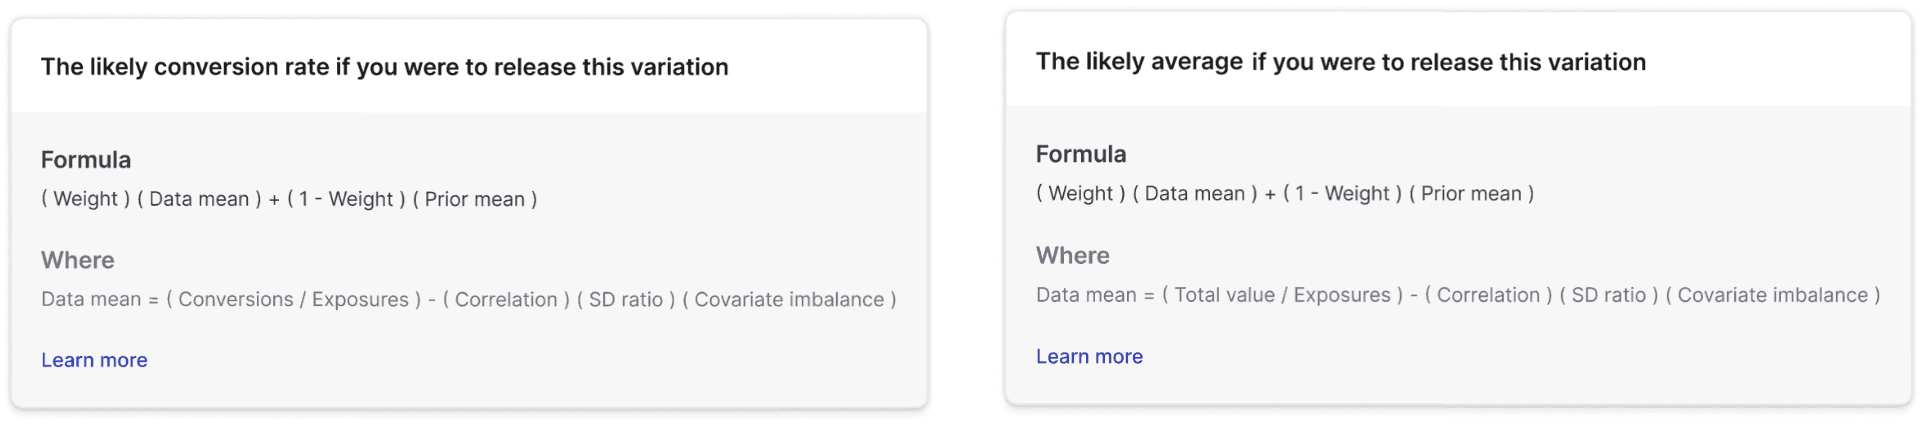
When CUPED is applied to an experiment metric, the estimated data mean equals the sample mean minus an adjustment, where the sample mean is either conversions over exposures or total value over exposures:
where the adjustment is the product of the following components:
- Correlation: the correlation between the experiment outcome and the pre-period covariate in the CUPED model
- Standard deviation ratio: the ratio of the standard deviation (SD) of the experiment outcome to that of the pre-period covariate
- Covariate imbalance: the difference between the covariate mean for the experiment variation and the covariate mean for all variations, which is a random imbalance due to sampling variability
This adjustment explains why the estimated conversion rate for a conversion metric may not equal the number of conversions divided by the number of exposures, and why the estimated posterior mean for a numeric metric may not equal the total value divided by the number of exposures.
When you hover over the "Conversion rate" and "Posterior mean" headings, you can view the above formulas for the data mean when LaunchDarkly applies CUPED:
Prior mean
For the control variation, the posterior mean equals the data mean, so there is no need to specify a prior mean. But for a treatment variation, the posterior mean is a precision-weighted average of a data mean and a prior mean, where the prior mean is the data mean for the control variation.
This is because we assume that the relative difference of the treatment variation mean above the control variation mean has a prior distribution centered at a zero mean. To learn more about the empirical Bayes prior for the relative difference, read Experimentation statistical methodology for Bayesian experiments.
Therefore, the treatment variation posterior mean is a precision-weighted average of the treatment variation data mean and the control variation data mean.
Precision weight
The precision weight is given by:
This means the proportion of the total precision due to the data mean. However, the precision is defined differently depending on the statistical model used.
There are two statistical models for estimating the posterior mean of experiment metrics:
- Normal-normal model: this model has a normal prior and normal likelihood, and is used for all average metrics when CUPED is applied, and all non-binary metrics when CUPED is not applied
- Beta-binomial model: this model has a beta prior distribution and a binomial likelihood, and is used for binary metrics when CUPED is not applied
For the normal-normal model, precision is defined as the inverse of the variance, so that the precision weight is:
For the beta-binomial model, precision is defined as the number of units for the data sample and the number of pseudo-units for the beta prior distribution. You can consider the and parameters of the beta prior distribution as, respectively, the number of converted pseudo-units and the number of non-converted pseudo-units, so that the number of pseudo-units for the prior distribution is . If we denote by the number of units in the data sample, then the precision weight is given by:
Conclusion
This guide explains the formulas LaunchDarkly uses to derive these experiment variation means in Bayesian experiments, and how they are useful for validating your results. To learn more about using the experiment results page, read Bayesian experiment results.
Your 14-day trial begins as soon as you sign up. Get started in minutes using the in-app Quickstart. You'll discover how easy it is to release, monitor, and optimize your software.
Want to try it out? Start a trial.