Analyzing experiments
Read time: 2 minutes
Last edited: Jul 01, 2024
Experimentation is available as an add-on to customers on a Pro or Enterprise plan. To learn more, read about our pricing. To add Experimentation to your plan, contact Sales.
Overview
This topic explains how to interpret an experiment's results and apply its findings to your product.
Experiment data
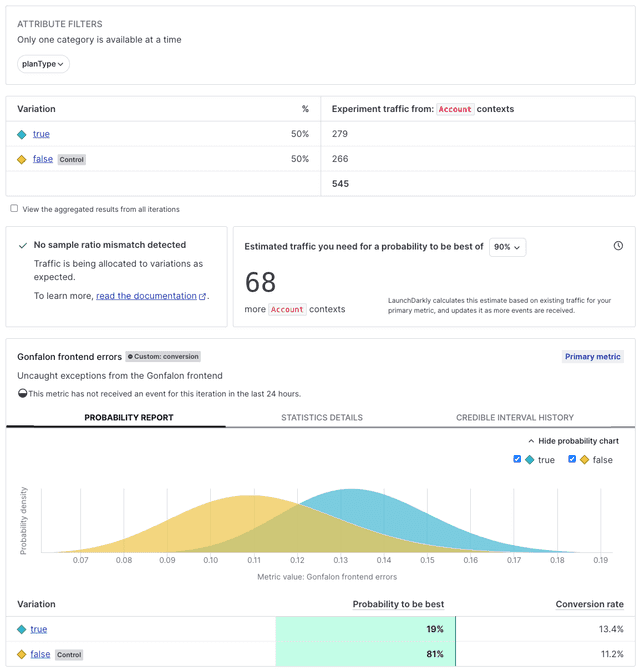
The data an experiment has collected is represented in its Results tab. The Results tab provides information about each variation's performance in the experiment, how it compares to the other variations, and which variations are likely to be best out of all the tested options. Understanding how to read this tab can help you make informed decisions about when to edit, stop, or choose a winning variation for your experiments.
Here is an example Results tab for an experiment:

This table explains the different sections of the Results tab and what you can use them for:
| Section | Example (click to enlarge) |
|---|---|
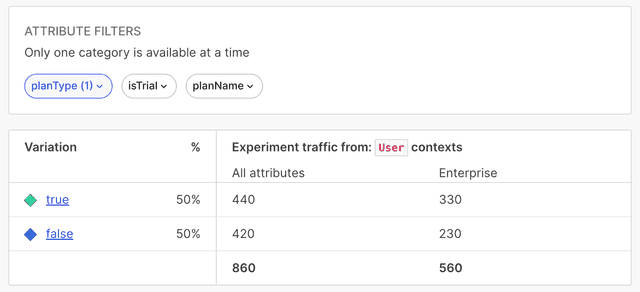
| Attribute filters and the traffic count table help you examine experiment results for certain cross-sections of your experiment audience. To learn more, read Slicing experiment results. | 
|
| The sample ratio mismatch section helps you understand when there may be an issue with your JavaScript-based SDKs. To learn more, read Understanding sample ratios. | 
|
| The sample size estimator helps you decide how long to run the experiment for. To learn more, read Experiment size and run time. | 
|
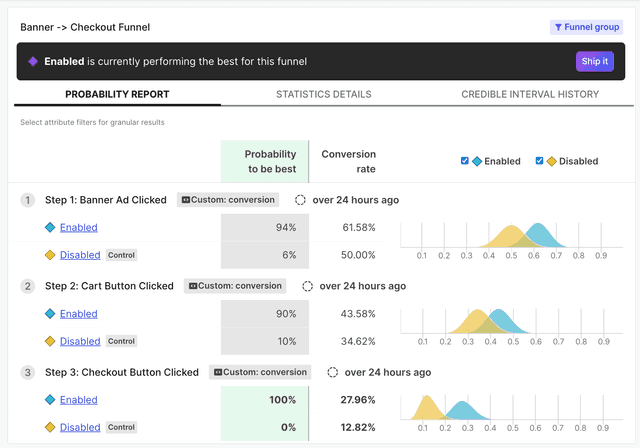
| An experiment's probability report tab displays the experiment's winning variation. To learn more, read Winning variations. | 
|
Further analyzing results
If you're using Data Export, you can find experiment data in your Data Export destinations to further analyze it using third-party tools of your own.
To learn more, read Data Export.